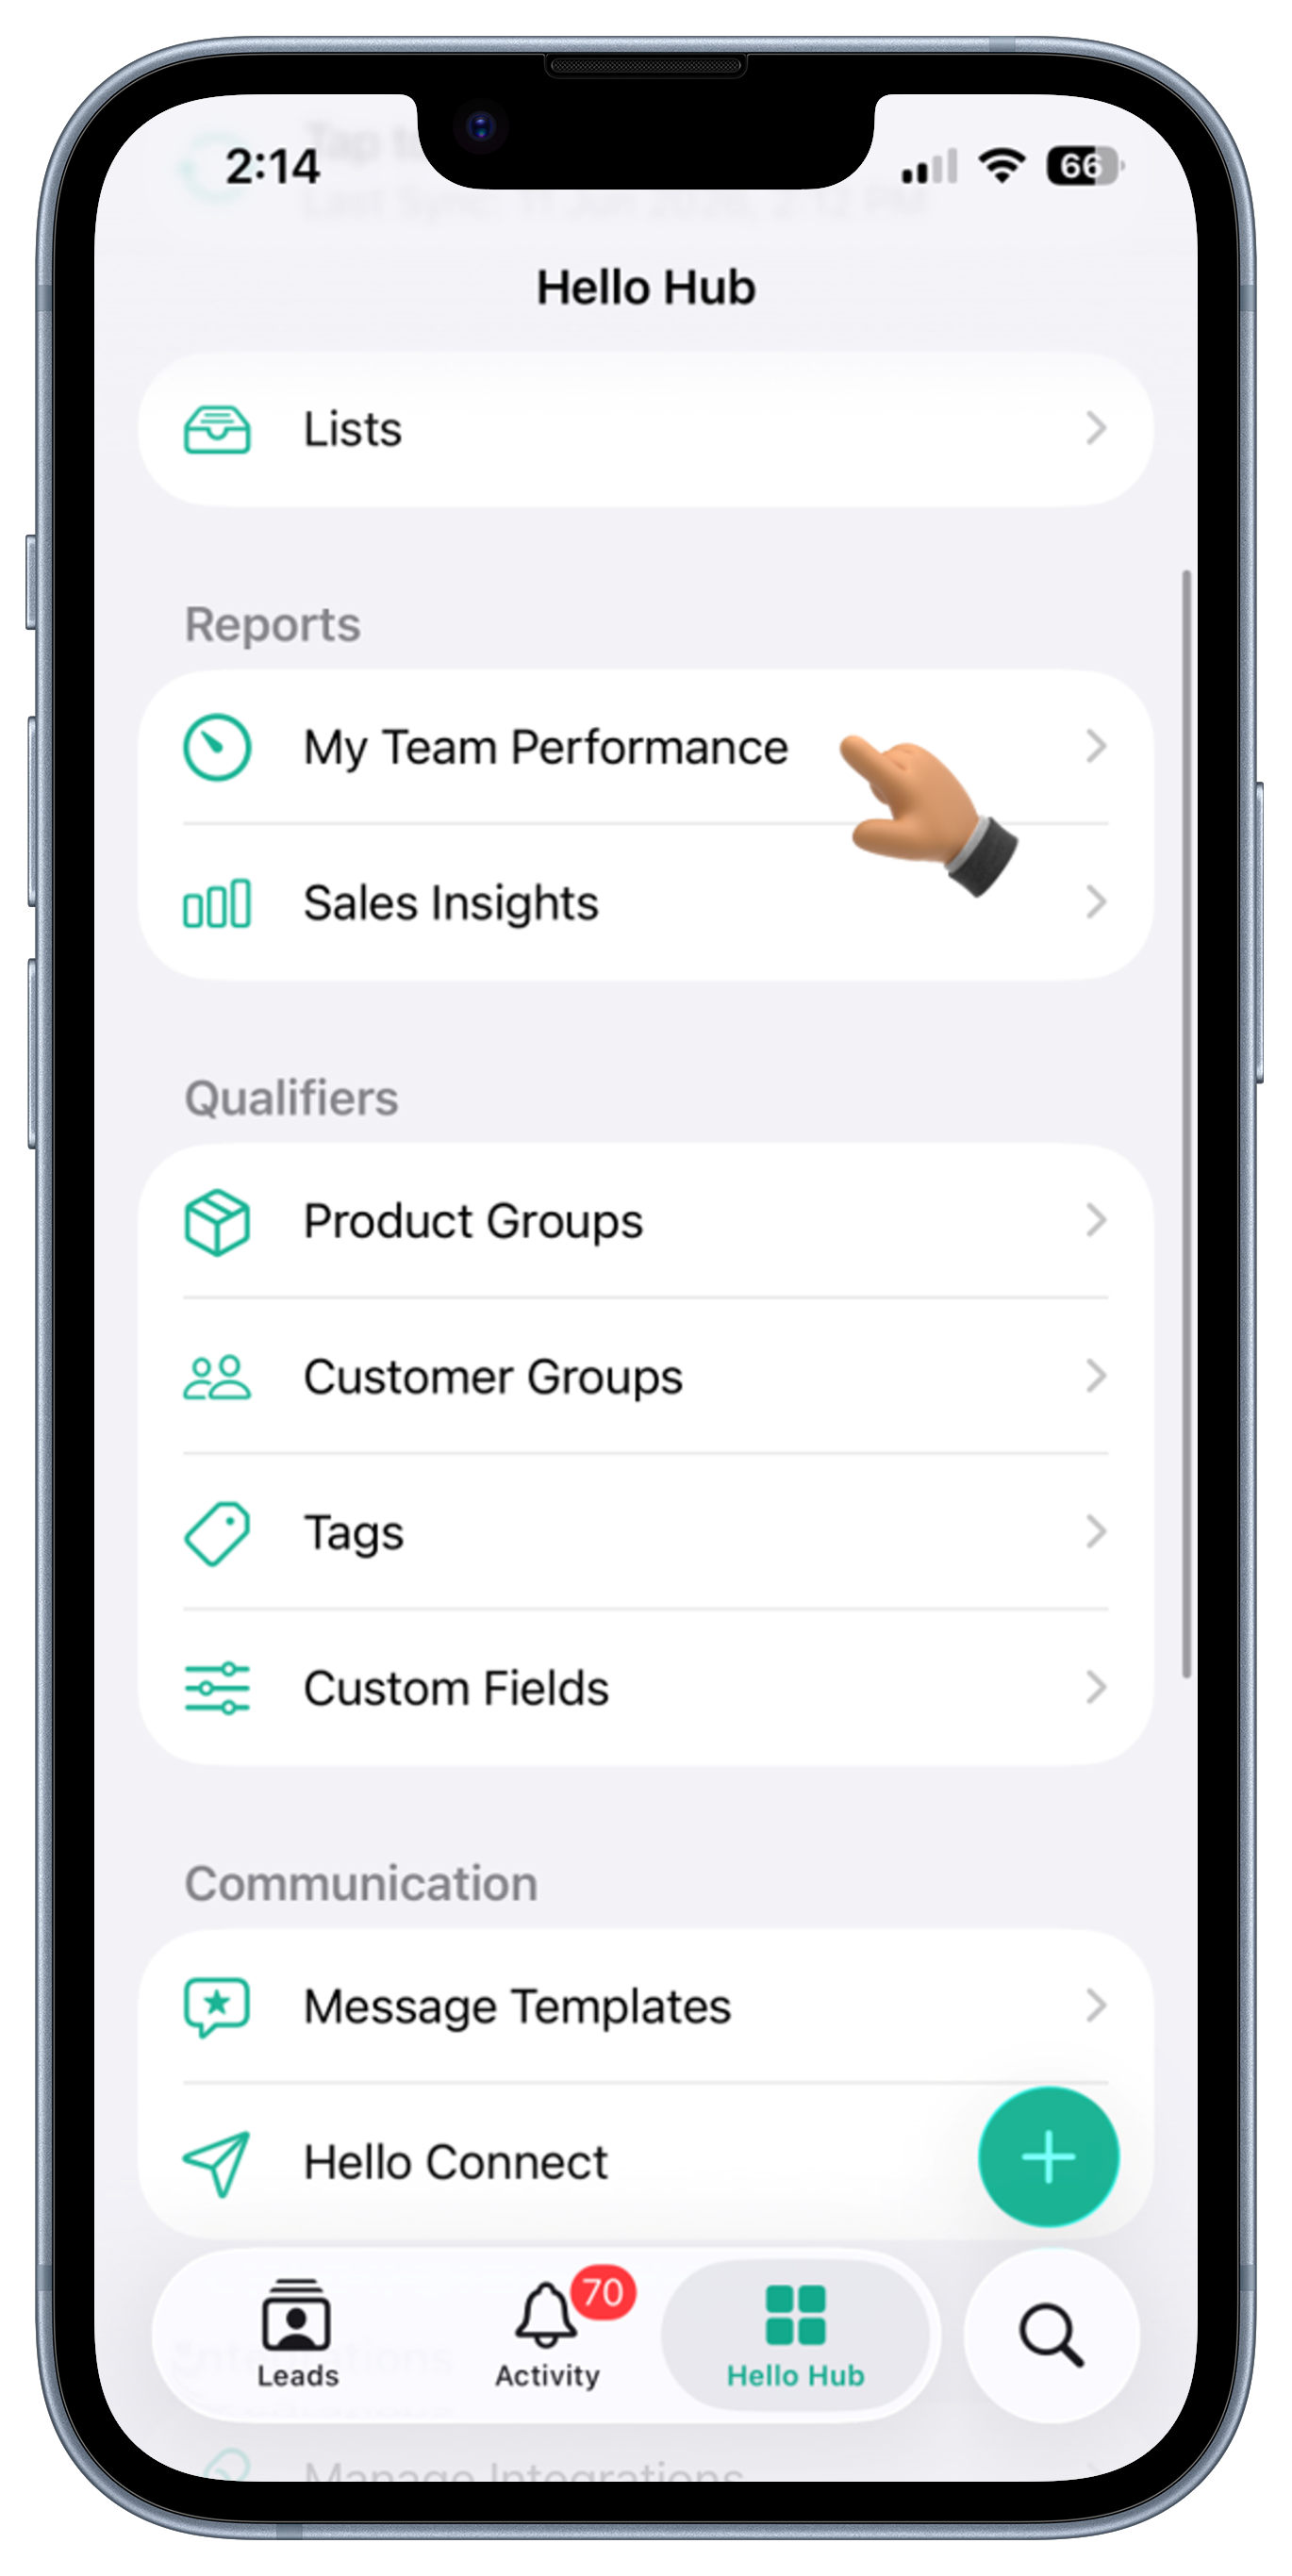
Select a Report Type
1
Choose the type of performance report you want to analyze
2
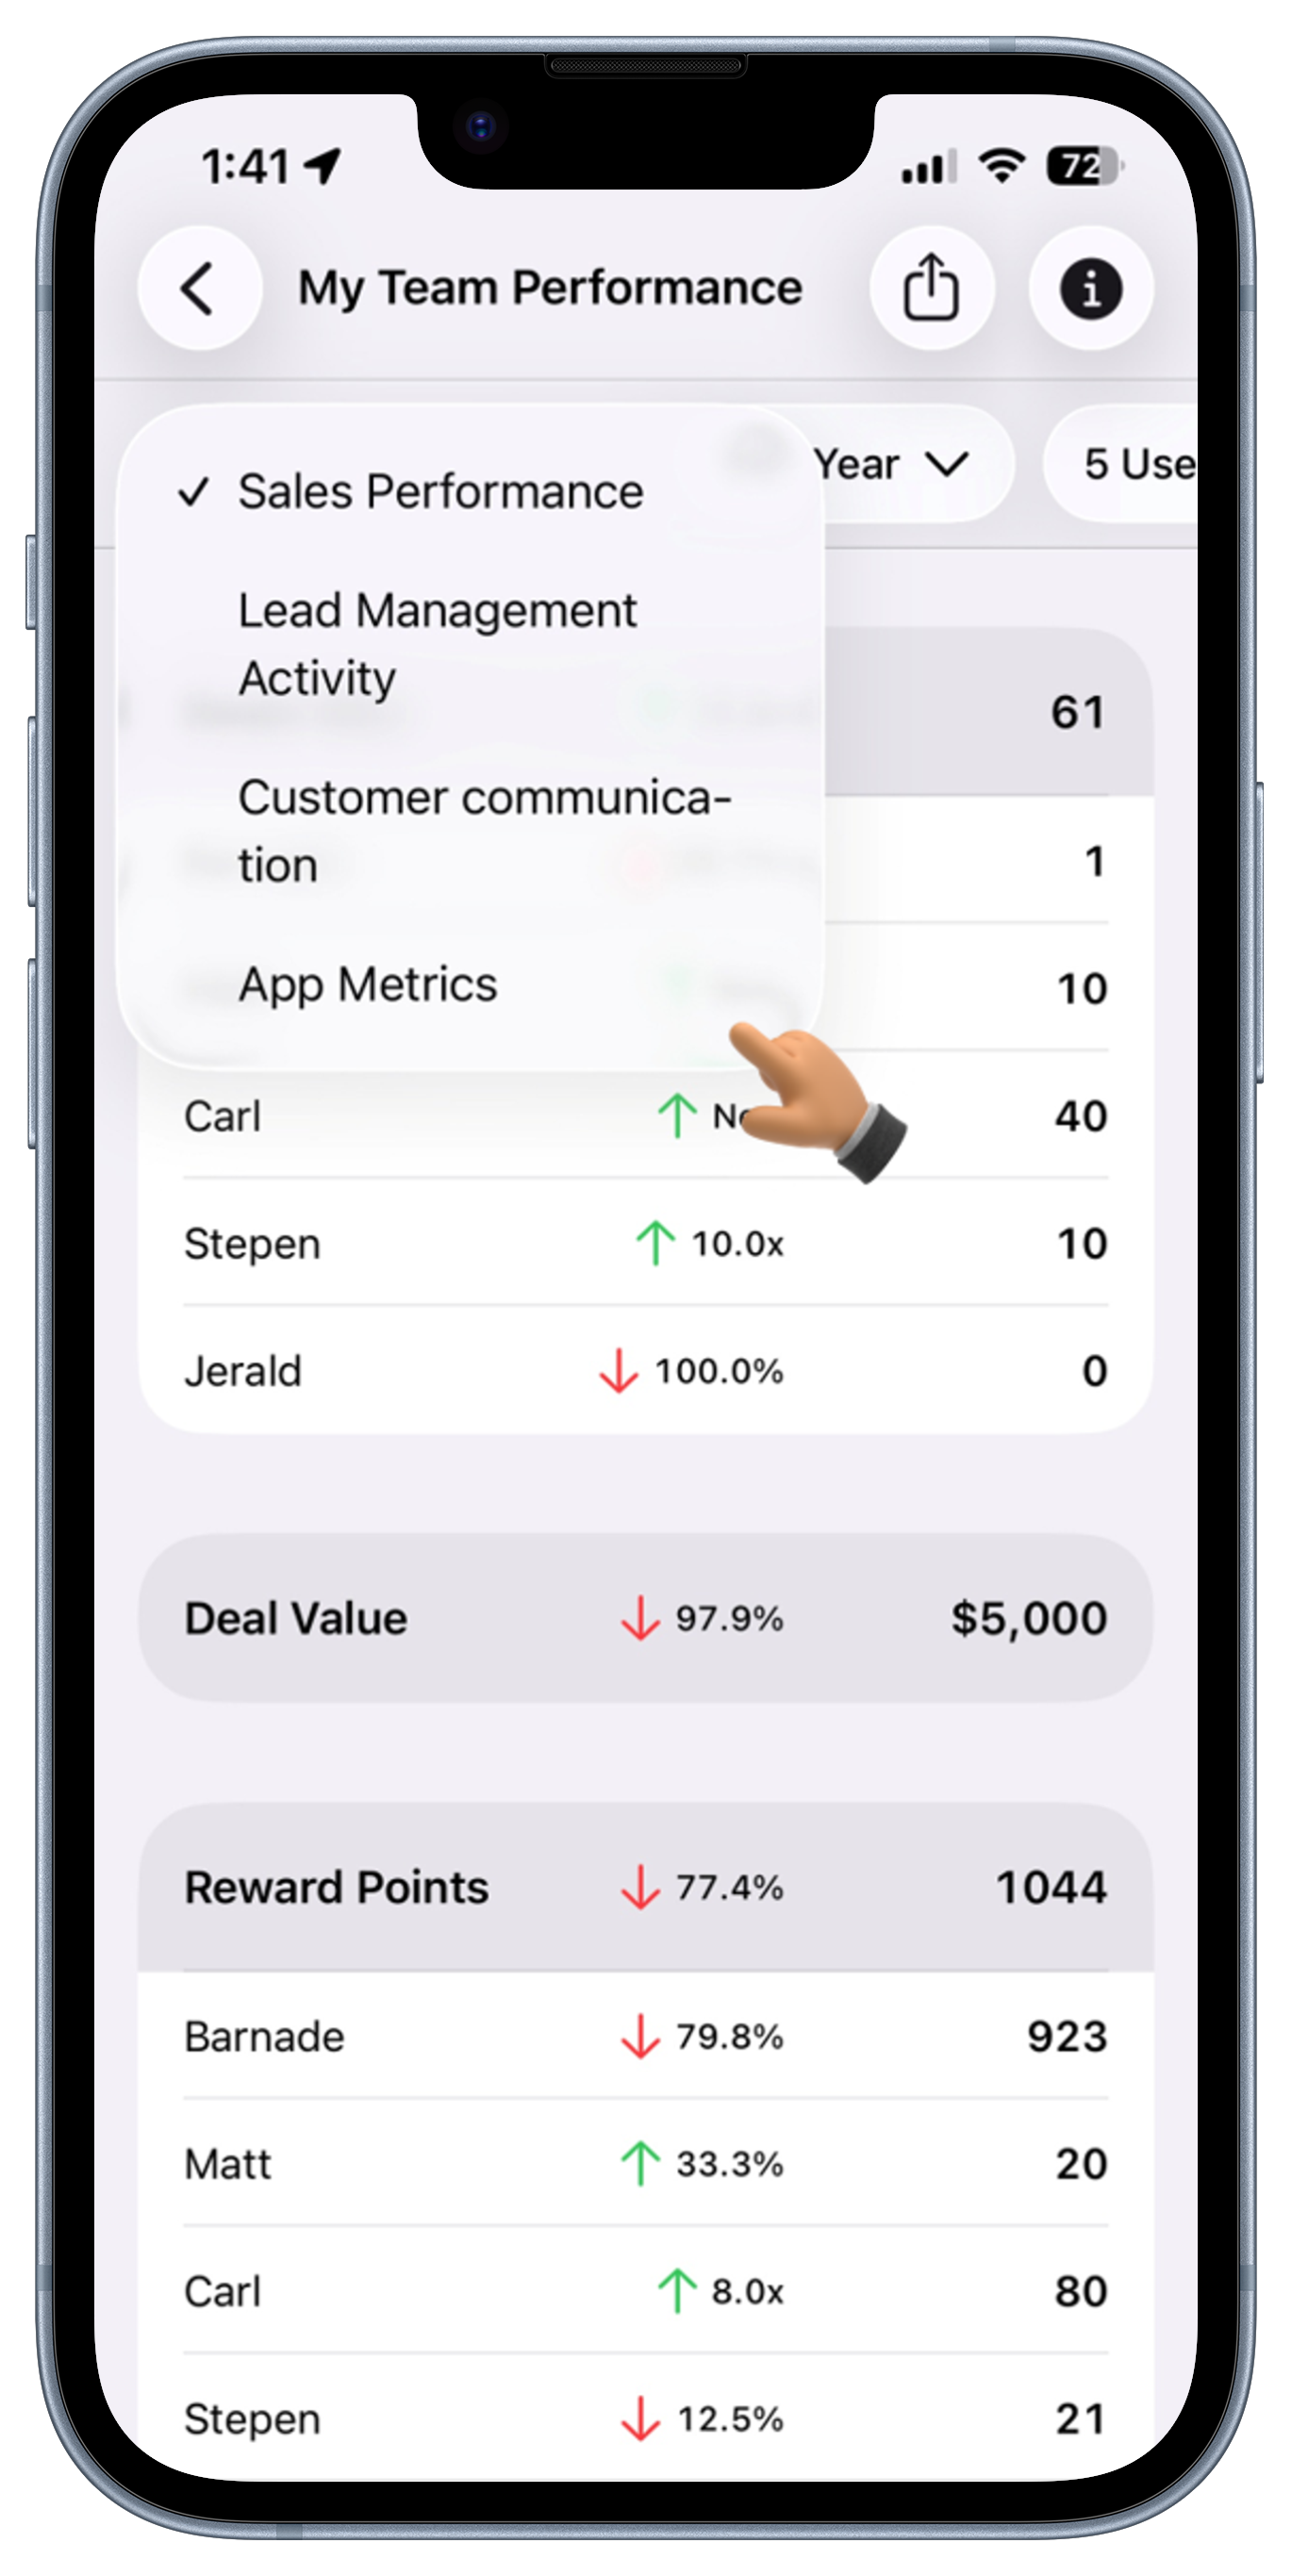
Select one of the following report categories:
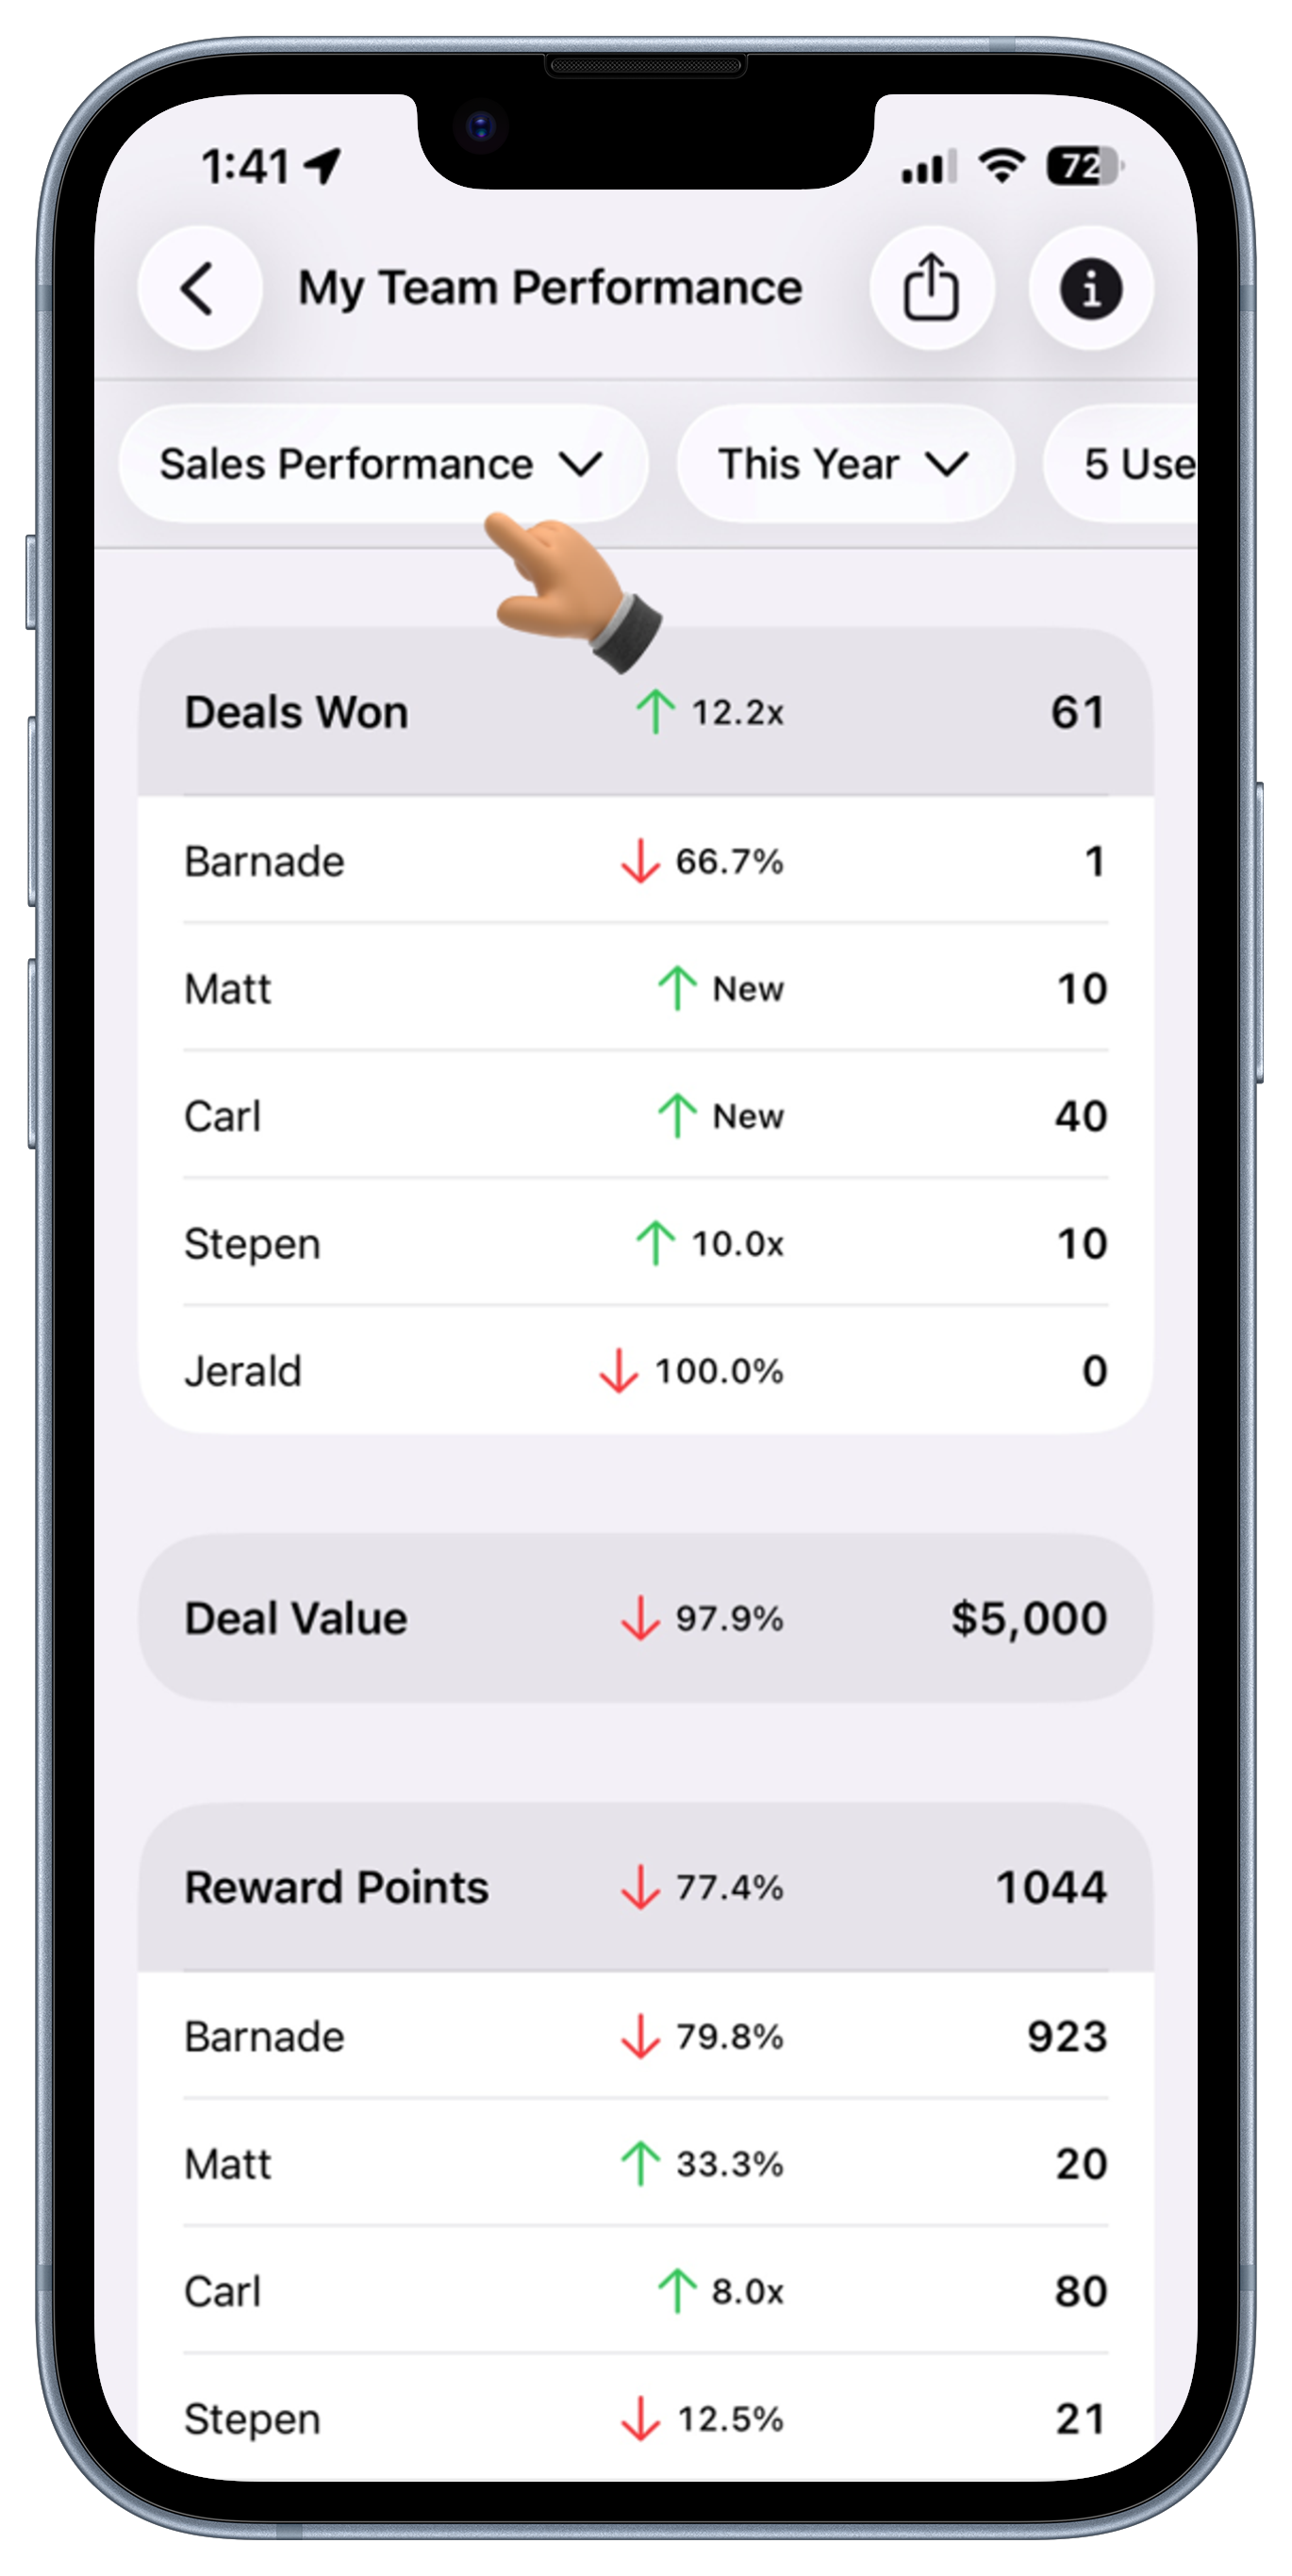
Sales Performance - Track business outcomes generated by your team
• Deals Won
• Deal Value Won
• Reward Points Earned
Lead Management Activity - Monitor CRM lead management activities
• Leads Added
• Comments Added
• Leads Assigned
Customer Communication - Analyze customer engagement across communication channels
• Total Calls Handled, Total Call Duration
• Incoming Calls Handled, Incoming Call Duration
• Outgoing Calls Handled, Outgoing Call Duration
• SMS Activities
• Email Activities
• WhatsApp Activities
App Metrics - Measure CRM adoption and application usage
• App Usage Time
• Quotes Created
• Invoices Created
• Locations Visited
Select a Timeline
1
Choose the period you want to analyze
2
Select one of the available timeline options:
• Today, Yesterday
• This Week, Last Week
• This Month, Last Month
• This Year, Last Year
• Lifetime
• Custom Date Range
3
The selected timeline determines the displayed data and trend calculations
Select Users
1
Choose the users whose performance you want to analyze
2
You can select:
• A Single User
• Multiple Users
• All Users
3
Compare individual performance or review overall team activity
Understand the Results
1
Review the performance cards displayed for the selected report
2
Each metric card displays:
• Total Metric Value
• Trend Indicator
• Percentage Change or Growth Multiplier
3
Review the user-level breakdown displayed below the summary
4
Each user row displays:
• User Name
• Metric Value
• Trend Indicator
• Percentage Change or Growth Multiplier
Understand Trend Indicators
1
HelloLeads automatically compares the selected period against the previous equivalent period
2
Trend indicators are displayed as follows:
↑ Positive Growth
Performance improved compared to the previous period.
↓ Performance Decline
Performance decreased compared to the previous period.
0%
No change between the current and previous period.
New ↑
No activity existed previously, but new activity is present in the current period.
—
No activity exists in either period.
5.0x ↑
Displayed when growth exceeds 100%, indicating a multiplier instead of a large percentage value.
Export Performance Reports
1
Apply the required report filters
2
Review the generated results
3
Tap Export CSV to download the report as a CSV file
Why Use My Team Performance?
→
Measure team productivity and sales performance
→
Track customer engagement activities
→
Compare individual and team performance
→
Identify top performers and coaching opportunities
→
Monitor CRM adoption and usage trends
→
Make data-driven sales and management decisions